In [1]:
%matplotlib notebook
In [16]:
import box0
import numpy as np
import matplotlib.pyplot as plt
# some constant
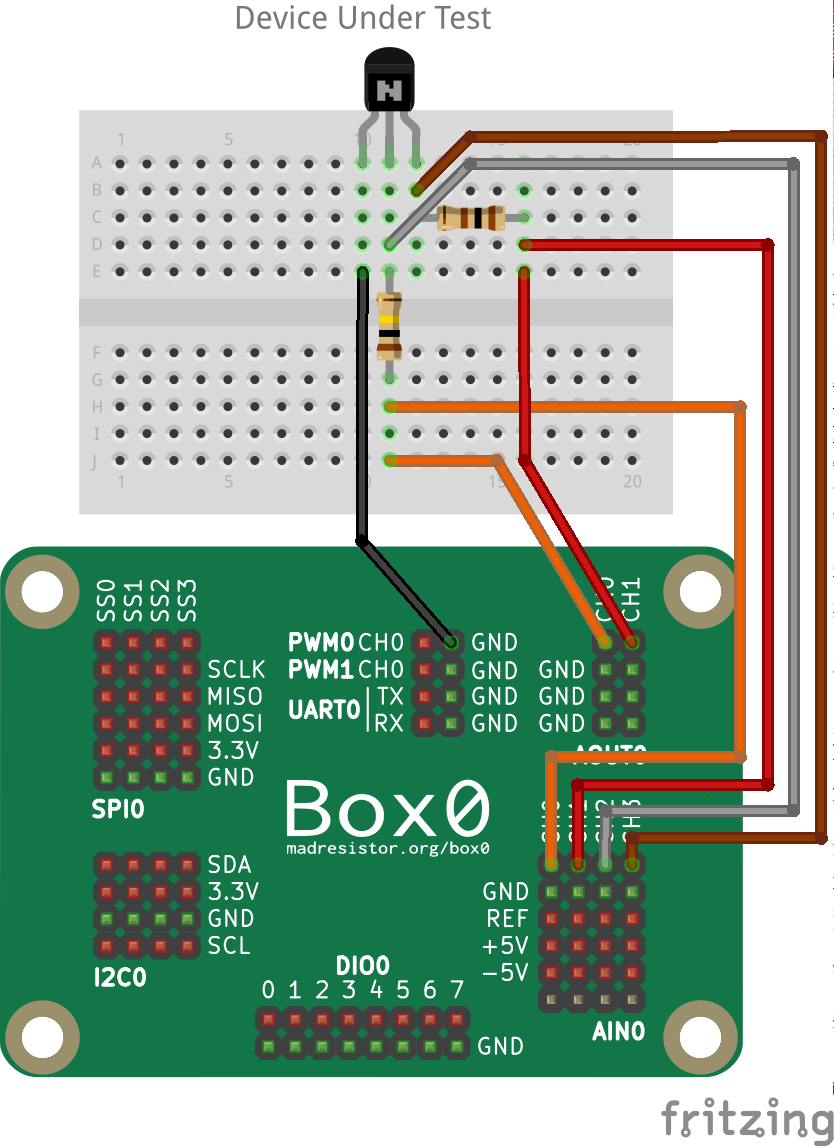
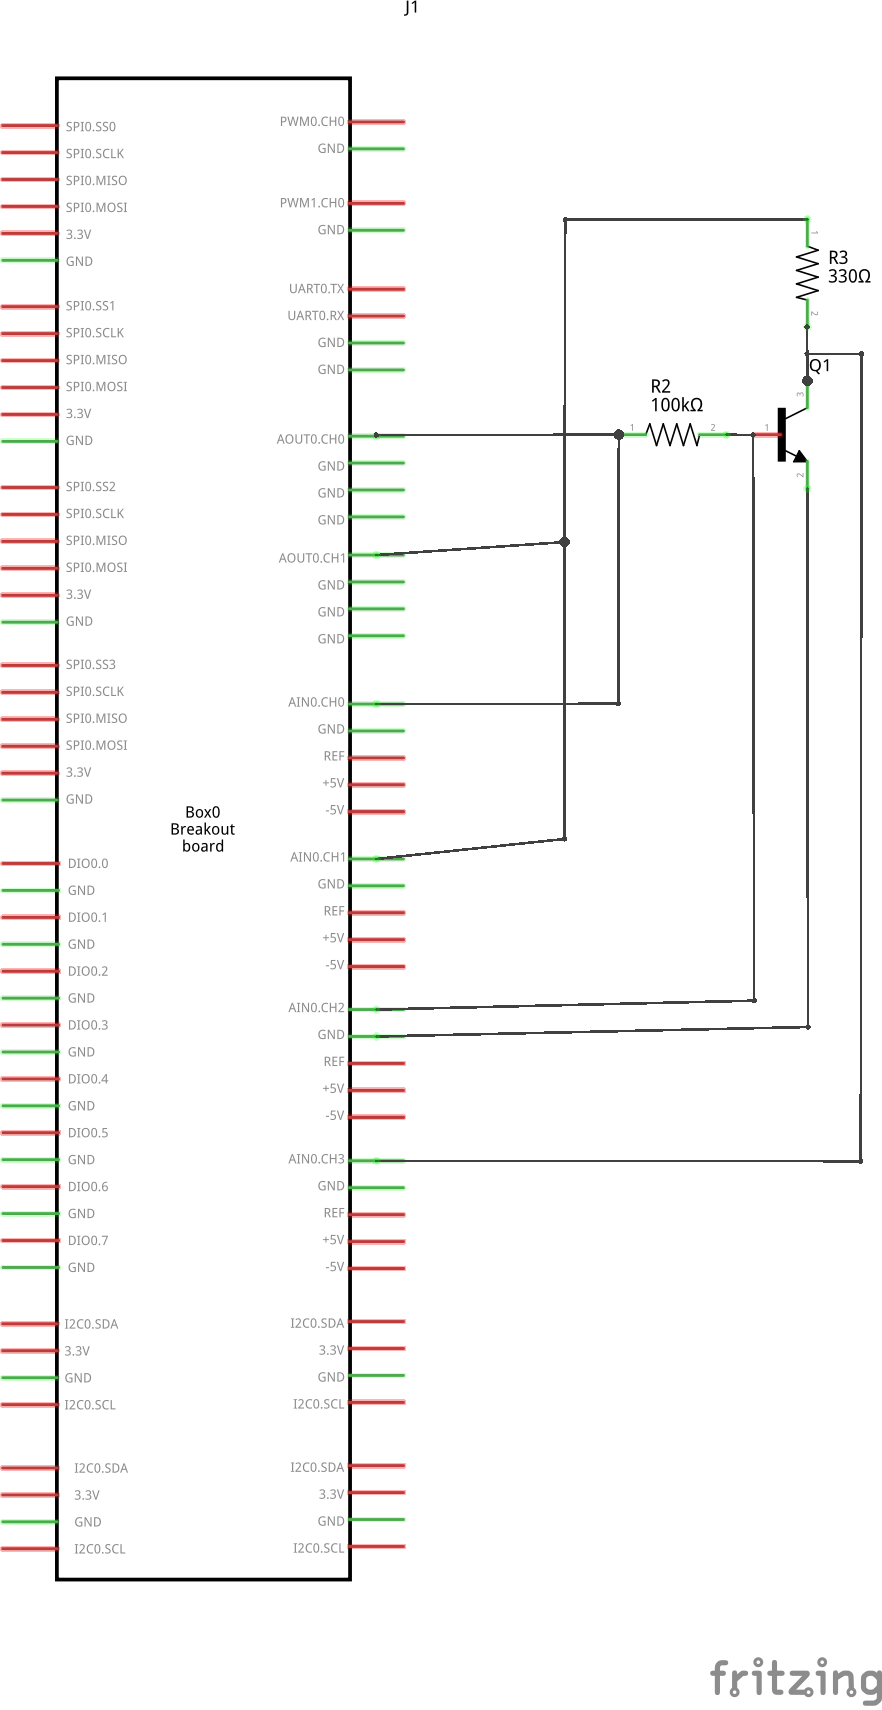
RESISTANCE_BASE = 100e3
RESISTANCE_COLLECTOR = 330
# allocate the appropriate resources
dev = box0.usb.open_supported()
ain0 = dev.ain(0)
aout0 = dev.aout(0)
# prepare the resources
ain0.snapshot_prepare()
ain0.chan_seq_set([0, 1, 2, 3])
ain0.bitsize_speed_set(12, 100000) # 100KSPS
aout0.snapshot_prepare()
aout0.chan_seq_set([0, 1])
aout0.bitsize_speed_set(12, 100000) # 100KSPS
def set_voltage(ch0, ch1):
"""Set voltage on AOUT0 pin"""
global aout0
# try to stop aout0 (from previous start)
try: aout0.snapshot_stop()
except: pass
data = np.array([ch0, ch1])
aout0.snapshot_start(data)
def get_voltage():
"""Get voltage on AIN0 pin"""
global ain0
data = np.empty(1000)
ain0.snapshot_start(data)
ch0 = np.mean(data[0::4])
ch1 = np.mean(data[1::4])
ch2 = np.mean(data[2::4])
ch3 = np.mean(data[3::4])
return ch0, ch1, ch2, ch3
def pretty_title_from_base_current(value):
"""return a pretty title using base input current"""
prefix = ""
if value < 1e-3:
prefix = "$\mu$"
value *= 1e6
elif base_current < 1:
prefix = "m"
value *= 1e3
return r'$I_{b}$ = %.3f%sA' % (value, prefix)
colors = ['#ff7f0e', '#2ca02c', '#d62728', '#7f7f7f', '#9467bd', '#8c564b']
for aout0_ch0 in [0.4, 0.7, 0.9, 1.1, 1.3, 1.5]:
arr_current_base = []
arr_current_collector = []
arr_voltage_collector_emitter = []
for aout0_ch1 in np.arange(0, 3, 0.05):
# set the values
set_voltage(aout0_ch0, aout0_ch1)
# get the values
ain0_ch0, ain0_ch1, ain0_ch2, ain0_ch3 = get_voltage()
# do the calculation
current_base = (ain0_ch0 - ain0_ch2) / RESISTANCE_BASE
curent_collector = (ain0_ch1 - ain0_ch3) / RESISTANCE_COLLECTOR
voltage_collector_emitter = ain0_ch3
# append to list
arr_current_base.append(current_base)
arr_current_collector.append(curent_collector)
arr_voltage_collector_emitter.append(voltage_collector_emitter)
# plot it
title = pretty_title_from_base_current(np.mean(arr_current_base))
color = colors.pop(0)
arr_current_collector = [x * 1e3 for x in arr_current_collector] # to mA
line = plt.plot(arr_voltage_collector_emitter, arr_current_collector, label=title, color=color, linewidth=2)
plt.text(arr_voltage_collector_emitter[-1], arr_current_collector[-1], title, fontsize=13, color=color)
# try to stop aout0 (from previous start)
try: aout0.snapshot_stop()
except: pass
# close the resources
ain0.close()
aout0.close()
dev.close()
#plt.legend()
plt.grid(True)
plt.xlabel(r"$V_{ce}$ (V)")
plt.ylabel(r"$I_{c}$ (mA)")
plt.show()
