In [40]:
%matplotlib inline
In [42]:
import box0
import numpy as np
import matplotlib.pyplot as plt
# allocate the appropriate resources
dev = box0.usb.open_supported()
ain0 = dev.ain()
aout0 = dev.aout()
# prepare AIN0
ain0.snapshot_prepare()
ain0.chan_seq_set([0, 1, 2, 3])
ain0.bitsize_speed_set(12, 100000)
# prepare AOUT0
aout0.snapshot_prepare()
# generate voltage, read voltage, calculate current and store the result
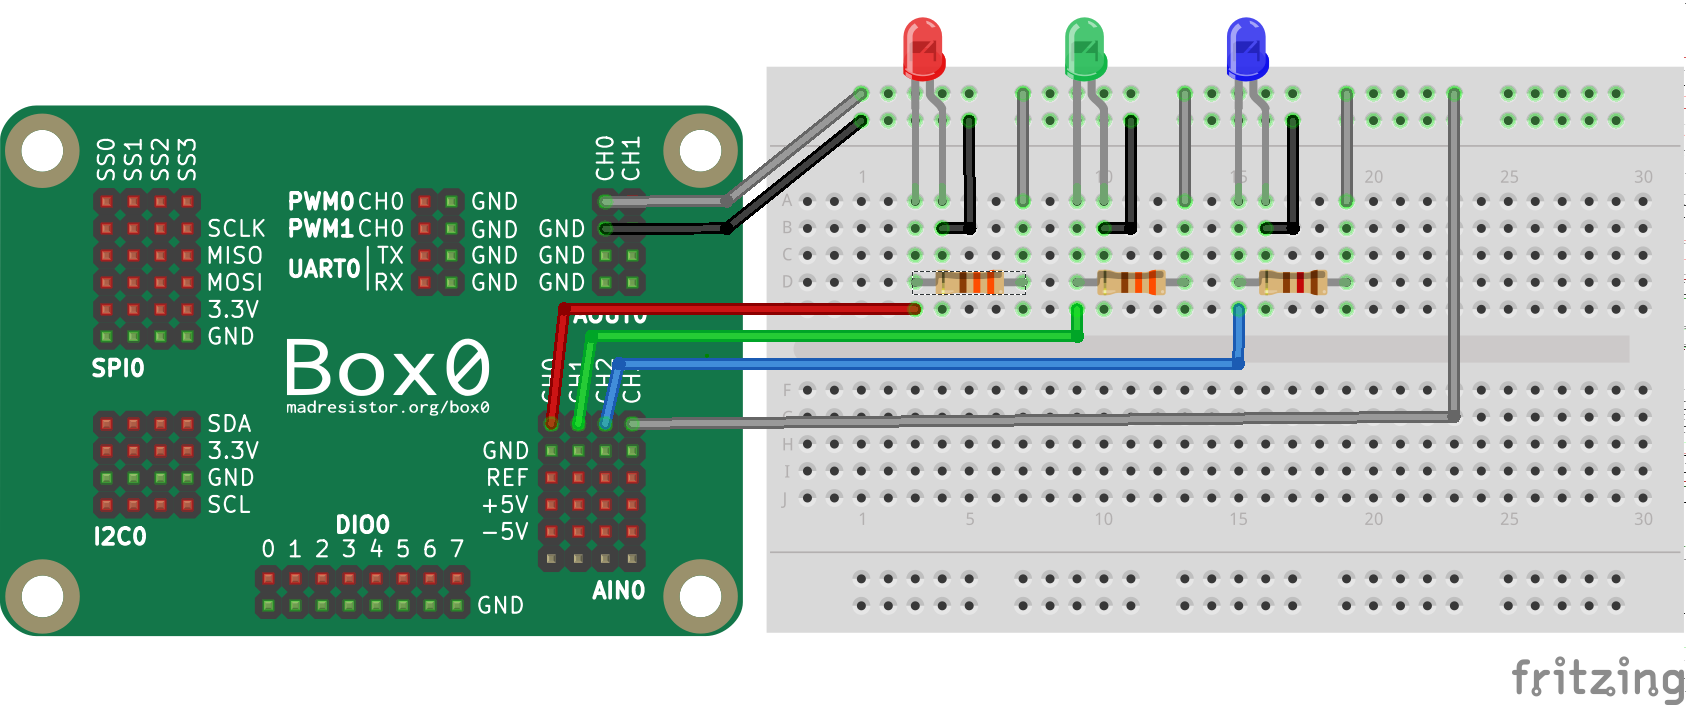
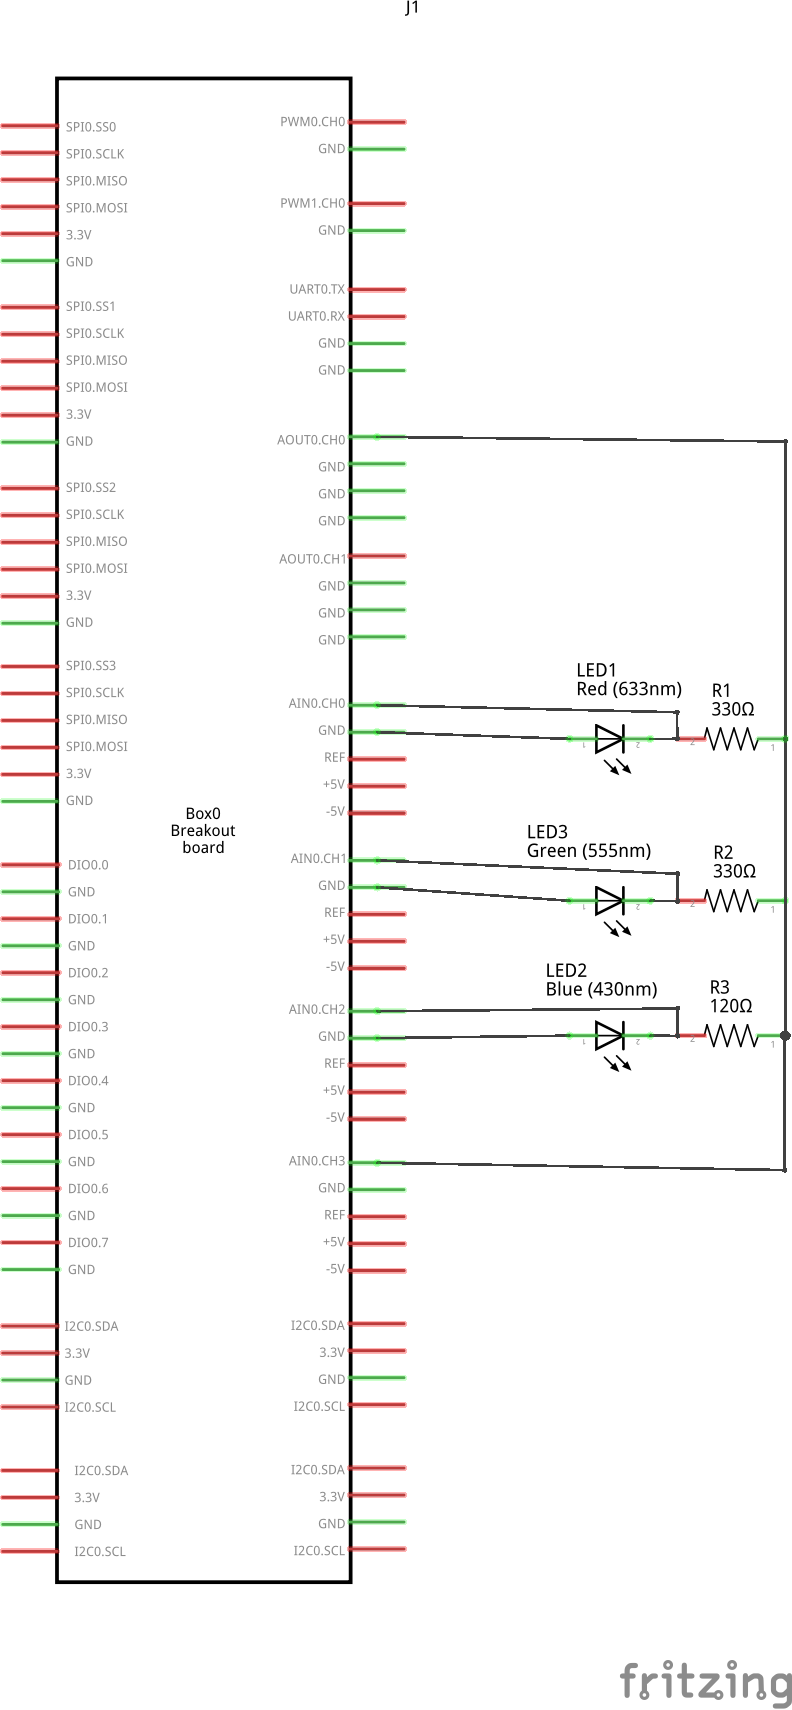
# AIN0.CH0 = Voltage across Red led
# AIN0.CH1 = Voltage across Green led
# AIN0.CH2 = Voltage across Blue led
# AIN0.CH3 = AOUT0.CH0 = generated signal
# current across LED = (AIN0.CH3 - AIN0.CHi) / Ri
SAMPLES = 100
red_res = 330.0
red_x = np.empty(SAMPLES)
red_y = np.empty(SAMPLES)
green_res = 330.0
green_x = np.empty(SAMPLES)
green_y = np.empty(SAMPLES)
blue_res = 120.0
blue_x = np.empty(SAMPLES)
blue_y = np.empty(SAMPLES)
voltages = np.linspace(0.0, 3.3, SAMPLES)
aout0_running = False
for i in range(SAMPLES):
if aout0_running:
aout0.snapshot_stop()
# output "v" value on AOUT0.CH0
aout0.snapshot_start(voltages[i:(i+1)])
aout0_running = True
# read back AIN0.CH0 and AIN0.CH1
readed_data = np.empty(1000)
ain0.snapshot_start(readed_data)
# do the calculation
ch0 = np.mean(readed_data[0::4])
ch1 = np.mean(readed_data[1::4])
ch2 = np.mean(readed_data[2::4])
ch3 = np.mean(readed_data[3::4])
# store the result
red_x[i] = ch0
red_y[i] = (ch3 - ch0) / red_res
green_x[i] = ch1
green_y[i] = (ch3 - ch1) / green_res
blue_x[i] = ch2
blue_y[i] = (ch3 - ch2) / blue_res
# stop if AOUT0 running
if aout0_running:
aout0.snapshot_stop()
# close the resources
ain0.close()
aout0.close()
dev.close()
# A to mA
red_y *= 1000.0
green_y *= 1000.0
blue_y *= 1000.0
# now, plot the data
plt.xlabel('Voltage (V)')
plt.ylabel('Current (mA)')
plt.grid(True)
plt.plot(red_x, red_y, 'r-', green_x, green_y, 'g-', blue_x, blue_y, 'b-', linewidth=1.5)
plt.show()

TODO
- do caliberation (the graph is showing Uncaliberated Result, current decrease as voltage increase till knee point)